
Creating Venn diagrams can be a hassle if you start from scratch. And with various diagram makers available on the internet, choosing the best can be confusing.
Curious to know the best Venn diagram maker you’ll ever find on the internet? Keep reading below!
Venn Diagram
As most people know, Venn diagrams show the relationship between two or more data sets. Formed using circles or other shapes that overlap with each other, a Venn diagram can highlight the commonalities of two or more items, objects, events, or data.
Those who studied Psychology and Social Studies, Mathematics and other Sciences are among the most frequent creators of this visual tool. Professionals also use this to present important data during their team meetings and discussions.
Good job for realizing that it is more time-efficient, hassle-free, and convenient to use an online Venn diagram maker!
But it is also a well-known fact that not everyone will find creating these Venn diagrams an easy task. For some, it could be tedious and time-consuming. For beginners and those not really familiar with its function, the task could be intimidating.
Skills in this digital age include computer literacy. Using designing software should not discourage individuals but instead, encourage them to explore their creative side!
This article aims to introduce to you the diagram maker that will give you a better designing experience.
Venngage: A Venn Diagram Maker, Free!
Venn diagrams have many purposes. But, whether you are working for Marketing and Communications, Human Resources, Business Management, Training and Development or for Executive Leadership, Venngage will surely improve your experience.
With Venngage, you can create, edit, and download templates of Venn diagrams as much as you want, for various purposes. This diagram may be used as an infographic, timeline, and mind map. It could make reports and guides more fun. It could be used to show processes and operations, vision and strategy, project management, and team alignment.
Venngage is a free design maker that provides access to templates and ready-made elements for one-time users. Those who would like to take their Venn diagram design level up a notch will be glad to know that there are also premium features.
With several available plans to choose from, you will never go out of choices. Whether for your personal or family use, corporate, educational, or non-profit purposes, Venngage will not let you down.
Venngage also offers its users more helpful features aside from those mentioned above, making it the best in the market.
It will allow you to automatically integrate your school’s or company’s branding easily with its automated branding feature. Students would also be grateful for the collaboration feature, which will allow multiple users to input and edit simultaneously, lessening the time consumed and effort applied in the process.
Add its easy data visualization interface and smart features to the mix, plus its diverse icons and photos. These will surely activate your creativity and the designer at heart.
Having the best design features is one thing, but being helpful and attentive to customers is another. Enjoy 24/7 online support from the Venngage team in case you encounter problems while using the software.
For Beginners: 2-Circle Venn Diagram Maker
Easily create a two-circle Venn diagram by just browsing through available stock templates and designs equipped with instructions on how and where to edit.
For a starting Venn diagram maker, Venngage is especially known for offering one of the most user-friendly mind maps, presentations, and best report makers.
So even if you are just a beginner in creating Venn diagrams either for educational or professional purposes, you can easily navigate your way in this software. It requires only the use of basic computer skills. These templates will also help you with the conceptualization of your ideas so you can easily translate them into these diagrams.
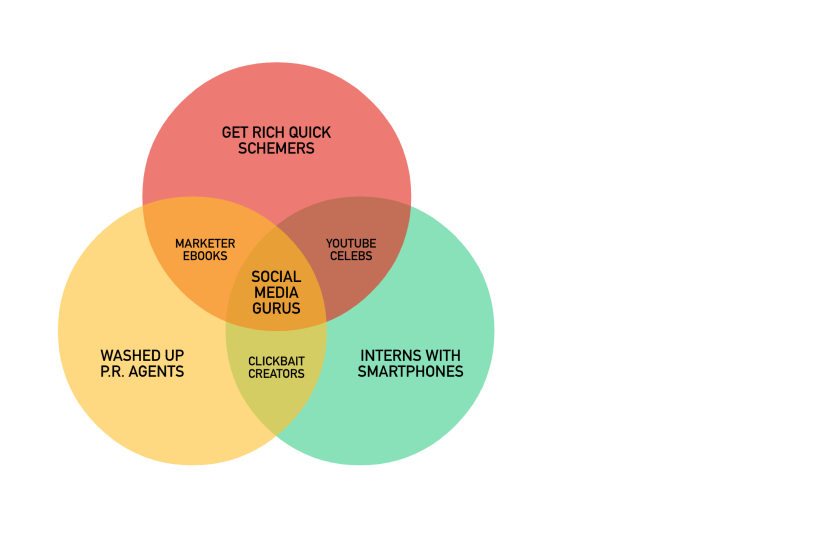
Your User-friendly 3-Circle Venn Diagram Maker
Using this Venn diagram creator, you can add another circle to the basic setup with no sweat to visualize the relationships among three objects, concepts, or sets of data.


